Definition of Data Visualization:
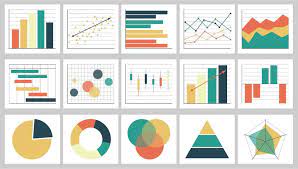
Data visualization is the process in which information is translated into easier to understand, visual contexts such as maps, graphs, or charts. Data visualization is mainly used to easily identify patterns, trends, and outliers, with better visual representation. (Kate Brush, 2023)
Why is data visualization important?
Graphics reveal data features that statistics and models may miss, such as unusual distribution of data, local patterns, gaps, missing values etc. which can lead to major business decisions being made under the wrong impression, without the entire picture. As stated earlier, data visualization is used to solve this issue through use of data cleaning, detecting outliers, and local patterns giving businesses the full picture of what their data is hiding, enabling them to make the right decisions with all the necessary information. (Antony Unwin, 2020)
Data visualization is used to show large and complex datasets in easier to understand visual formats, making the data easier to interpret and to understand.
Reveals patterns and trends
Data visualization can reveal patterns and trends that might not be as noticeable in raw, or mathematical form (statistics). This can lead to making decisions not only faster, but more accurately, as businesses can get the full scope of their data.
Improves retention and engagement.
Visual data is more engaging and more interesting than raw data, making it easier to remember and engage with. A well demonstrated visual can tell an impactful story about the data, while keeping the data easy to remember and useful.
Increases accessibility.
Data visualization makes data easier to understand and apply, making the data more accessible to a wider audience.
Improves risk management.
Data visualization helps organizations understand complex scenarios that involves risk and uncertainties better. The simplification of data, can help organizations identifying the problem areas of a decision.
Data analytics and data visualization are two terms that commonly gets confused. Let's look at some key differences that sets these terms apart: (Pedamkar, 2023)
Element
Data Visualization
Data analytics
Uses
The goal is to communicate information clearly and in an easy to understand way using visual tools
Is used to analyze and find answers to queries that can be made on the data. (The data gets broken down into useful information such as what product sells the most etc.)
Relation
Data visualization helps data analytics to get better insights on their findings
Data analytics finds the end information that is displayed using data visualization
Techniques and Methods
Can be static or interactive. Interactive data visualization lets people drill down into the very fine details of charts and graphs, and then interactively be able to change which data they want to see and how it's processed.
Can be prescriptive analytics, predictive analytics, diagnostic analytics and descriptive analytics
Specialists
Data Visualization Specialists are called Data Engineers
Data analytics Specialists are called Data Analysts
Platforms
Big data processing, Service management dashboards, Analysts and design
Big data processing, Data mining, Analysis and design
Benefits
identify areas that need more attention
Clarify which factors has the biggest influence on customers
Helps understand which product to place where
Predict sales volumes
identify the underlying models and partners
Acts as input source for data visualization
Helps in improving the business by predicting the needs
Antony Unwin. (2020) 'Why Is Data Visualization Important? What Is Important in Data Visualization?', Harvard Data Science Review, 2(1). doi:10.1162/99608f92.8ae4d525.